Select dates
Define the period you want to query to narrow the report.
Reports to understand what is being printed, copied and scanned, who does it and what it costs.
From the PryntControl web interface you can generate reports by date range and analyze real center usage: color pages, black and white pages, scans, jobs and equivalent cost according to configured pricing.
Printing stops being an opaque expense. PryntControl lets you review activity, compare consumption and detect patterns by user, printer or user group.
Every report starts from a clear period.
Color, black and white, scans, jobs and cost.
By user, printer or user group.
Paper, document, pages and job characteristics.
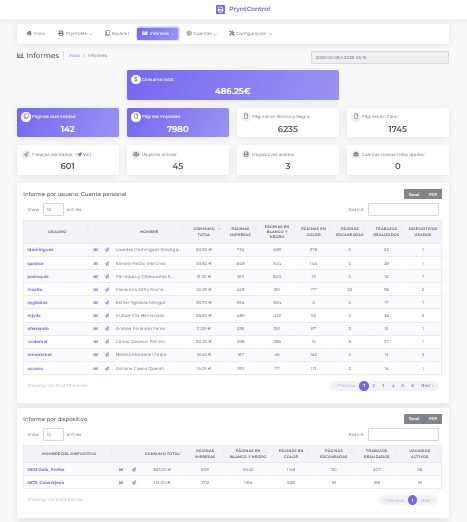
Reports are divided into two main areas: usage and cost summaries, and detailed job reports.
Total and segmented summary of printing, copying and scanning consumption.
Select a date range and PryntControl calculates total color pages, black and white pages, scanned pages, completed jobs and equivalent cost according to the center pricing rules.
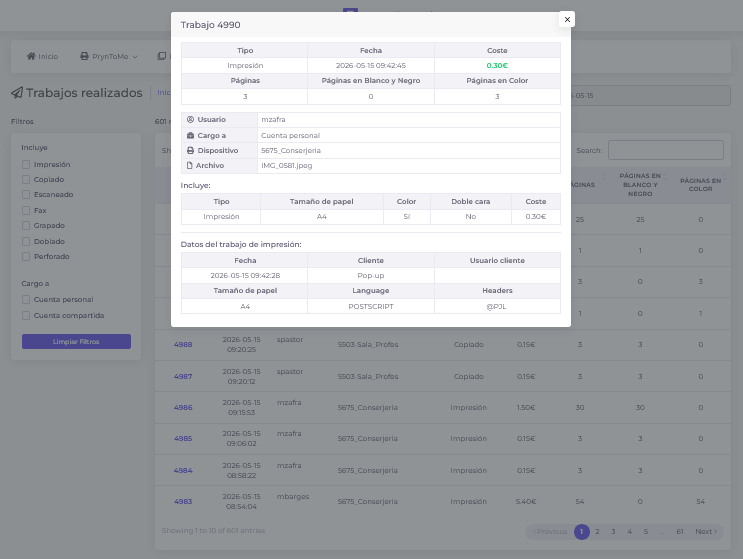
List of completed jobs and their characteristics.
In addition to aggregated summaries, PryntControl can generate reports of all completed jobs or filter them by user, device or job type. From there, each action can be reviewed in detail.
Define the period you want to query to narrow the report.
Review all data or filter by user, printer, group or job type.
PryntControl calculates pages, scans, jobs and equivalent cost.
Open details to understand what was done and with which characteristics.
We can prepare a demo with reports by dates, users, printers and groups.